Actuator Design Document
Product design
Requirements
- Health Check
Use the actuator interface to access health status of all internal Layotto components and business applications uniformly
- View running metadata
Access to Layotto its own metadata information (e.g. version, git information) and to the metadata information for business applications (e.g. a list of configuration items subscribed to by the Configuration Centre, such as app version information) can be obtained uniformly via the actuator interface.
- Supporting integrated and open source infrastructure, including:
- Can integrate into k8s health check
- Can be integrated into monitoring systems, such as Prometheus+Grafana
- If necessary, the registration centre may remove the node based on the results of the health check
- This interface can be used as the dashboard project or GUI tool to list problems.
- Similar to Spring Boot Actuator, more imaginary space:Monitoring, Metrics, Auditing, and more.
Explanation
Q: What values?Who is using the health check interface opened?
-
For developing troubleshooting, direct interfaces to query runtime information, or a dashboard page/GUI tool
-
For monitoring system monitoring;
-
Automated shipping for infrastructure, such as deploying systems based on health checks to judge deployment progress, stop or continue to deploy in batchs; e.g. registration centres remove abnormal nodes based on health check-ups; e.g. k8s recreate containers based on health check-ups
Q: It looks like returning a status code is running, there is no need to return running information?Who will find detailed information on the run?
- This interface can be used as a dashboard page or GUI tool for troubleshooting questions;
Similar to the spring boot community wrote a spring boot admin page for reference [https://segmentfault.com/a/1190000017816452](https://segmentfault.com/a/1190000017816452](https://segmentfault.com/a/1190000017816452).
- Integrated Monitoring System: Access to Prometheus+Grafana
Similar to Spring Boot Actuator's access to Prometheus+Grafana referenceSpring-Boot-Metrics监控之Prometheus-Grafana
Q: Do not control capabilities like "toggle the traffic of specific components inside Layotto"
A: No, switching parts will leave the app in partial failure, with uncertainty. But follow-up could consider adding debug capabilities such as mock, packets, etc.
Q: Health check interface does not allow permission control
A: Do not get started with feedback needs plus hook
Overview design
Overall programme
Open the http's interface first, because the health screening function of open source infrastructure basically supports https (e.g. k8s, prometheus) and does not support grpc.
In order to be able to reuse filters such as MOSN authentication, Actuator will run on MOSN as a seven-storey filter.
Specifically, MOSN adds a listener, writing a new stream_filter, which is responsible for http's request processing and calling the Actuator.
The Endpoint concept is abstracted within the actuator, and when a new request arrives on the server, the Actuator will commission the corresponding endpoint.Endpoint supports the extension and injection of actuator:
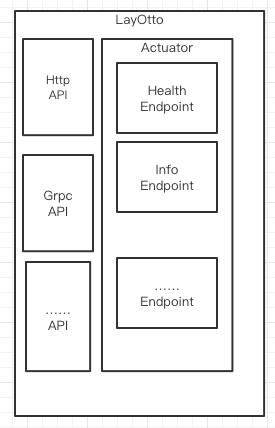
Http API Design
Pathways interpretation
Path is restul style. After different Endpoint is registered in actuator, the path is
/actuator/{endpoint_name}/{params}
like
/actuator/health/livelihood
The name of the health flag endpoint is health,liveness is the parameter passed to the endpoint.
Parameters are supported for multiple passes, such as /a/b/c/d, and the semicolon is defined by each endpoint itself
Default registered path is:
/actuator/health/liveness
/actuator/health/readability
/actuator/info
Health Endpoint
/actuator/health/livelihood
GET
// http://localhost:8080/actuator/health/liveness
// HTTP/1.1 200 OK

{
  "status": "UP",
  "components": {
    "livenessProbe": {
      "status": "UP",
      "details":{

      }
    }
  }
}
Returns field description: HTTP status code 200 for successes, others (over 400) failed status field with cascade:
var (
	// INIT means it is starting
	INIT = Status("INIT")
	// UP means it is healthy
	UP = Status("UP")
	// DOWN means it is unhealthy
	DOWN = Status("DOWN")
)
/actuator/health/readiness
GET
// http://localhost:8080/actuator/health/readness
//HTTP/1. 503 SERVICE UNAVAILABLE

LO
  "status": "DOWN",
  "components": LO
    "readinessProbe": LO
      "status": "DOWN"
    }
  }
}
Info Endpoint
/actuator/info
GET
// http://localhost:8080/actuator/health/liveness
// HTTP/1.1200 OK

LO
    "app" : LO
        "version" : "1.0.0",
        "name" : "Layotto"
    }
}
Q: What is running time metadata?
Junk:
- Version number
You can add:
- Callback app
- Runtime config parameter
Q: Are components required to perform health check interfaces?
Don't force for now
Data model for configuration of data
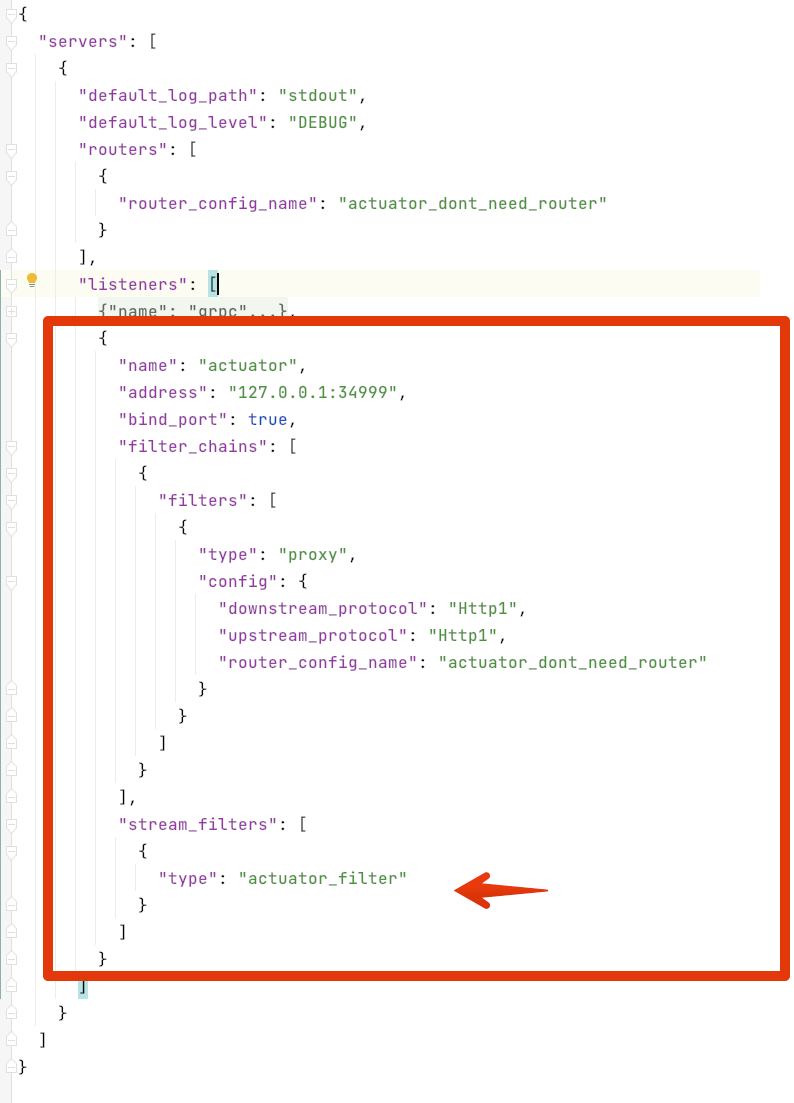
Add a listener to handle actuator,stream_filters adding actuator_filter, to handle actuators' requests (see below)
Internal structure and request processing process
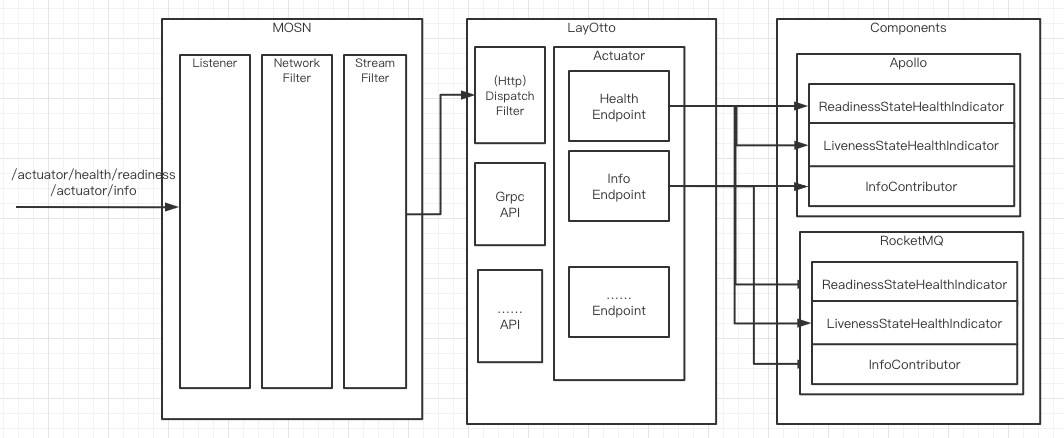
Explanation:
Request arrived at mosn, enter Layotto via stream filter and call actuator
Stream filter implementation class is DispatchFilter, responsible for distributing requests and calling actuator along the http's path:
type DispatchFilter struct {
	handler api.StreamReceiverFilterHandler
}

func (dis *DispatchFilter) SetReceiveFilterHandler(handler api.StreamReceiverFilterHandler) {
	dis.handler = handler
}

func (dis *DispatchFilter) OnDestroy() {}

func (dis *DispatchFilter) OnReceive(ctx context.Context, headers api.HeaderMap, buf buffer.IoBuffer, trailers api.HeaderMap) api.StreamFilterStatus {
}
The protocol layer and actuator decouple coupling. If interfaces from other protocols are required in the future, the protocol will be implemented with stream.
Request for distribution to End point within Actuator
Reference is made to the design of spring boot actuator: Actuator abstracts the Endpoint concept to support the expansion and inject the Endpoint as needed.Health and info EndPoint are implemented in-house.
type Actuator struct {
	endpointRegistry map[string]Endpoint
}

func (act *Actuator) GetEndpoint(name string) (endpoint Endpoint, ok bool) {
	e, ok := act.endpointRegistry[name]
	return e, ok
}

func (act *Actuator) AddEndpoint(name string, ep Endpoint) {
	act.endpointRegistry[name] = ep
}
The request will then be distributed to the corresponding endpoint according to the path.e.g. /actuator/health/readiness will be distributed to health.Endpoint
Health.Endpoint requests for distribution to health.Indicator
Component to report health check information implements the Indicator interface, inject health.Endpoint:
Type Indicator interface LO
	Report() Health
}
Health.Endpoint will distribute the request to health.Indicator
Info.Endpoint requests for distribution to info.Contributor
Components that need to report runtime information achieve Contribor interface, inject info.Endpoint:
type Contributor interface {
	GetInfo() (info interface{}, err error)
}
info.Endpoint request for distribution to info.Contributor implementation
Detailed design
Scene design
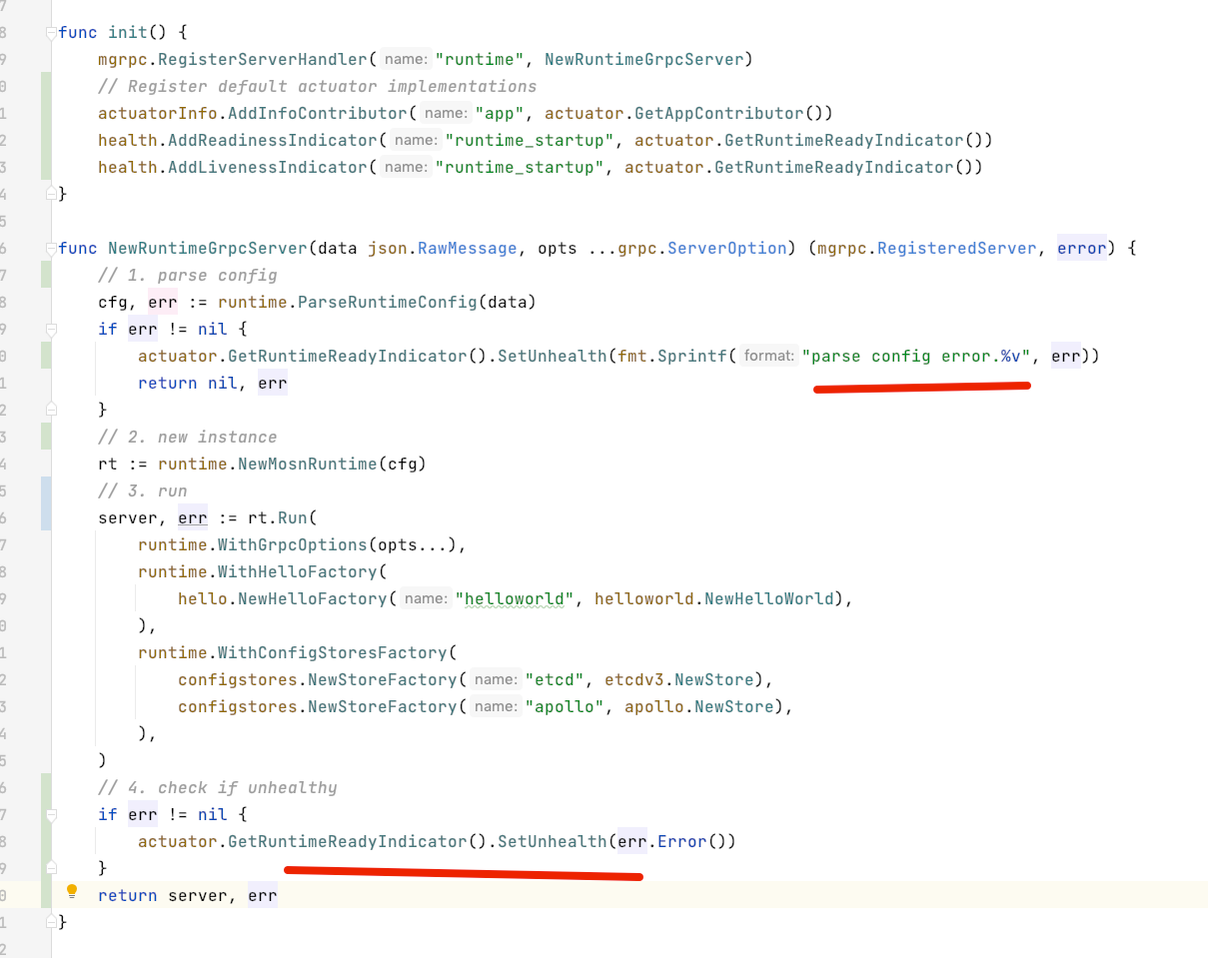
runtime_startup
- SetsStarted
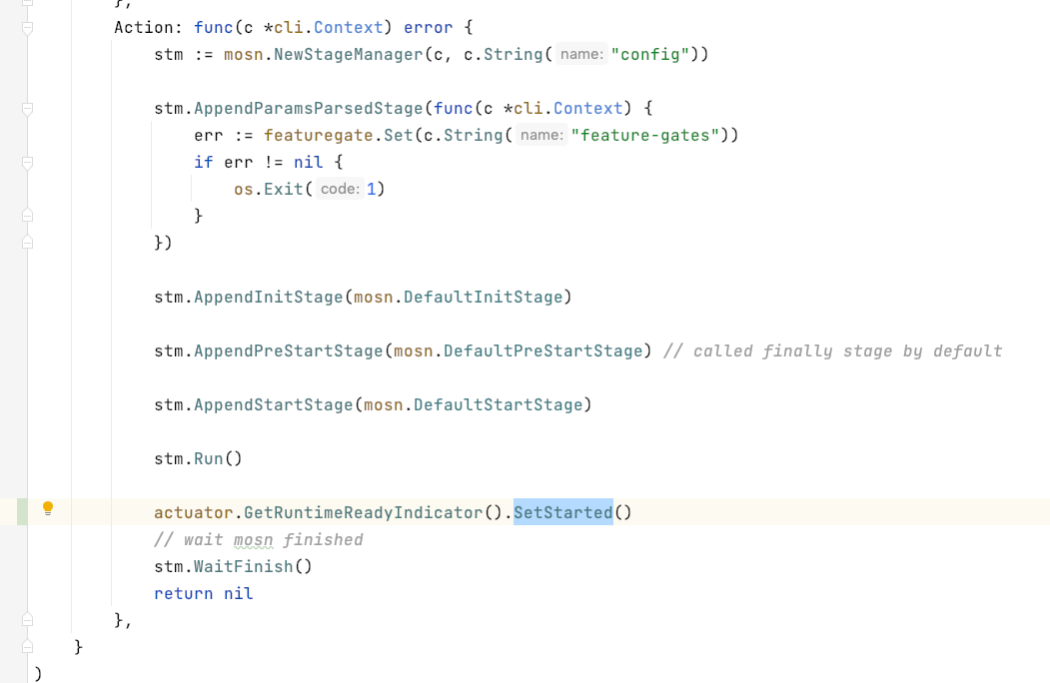
- SetUnhealth burial point
Startup failed:
On Stop's:

Apollo components
init:
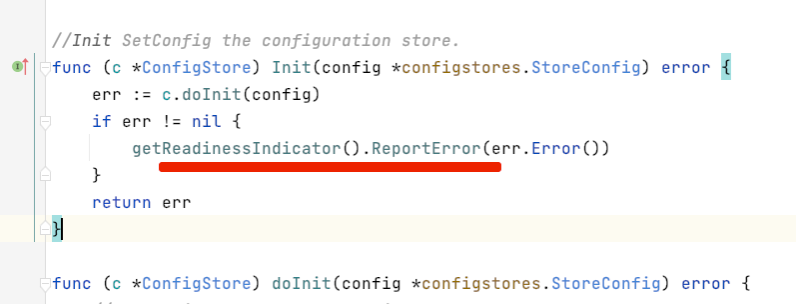
There is no place where the burial is required, because the runtime_startup indicator can also report unhealth if the initialization connection fails.